9 WhatsApp Campaign Metrics Worth Tracking
Open rate is the least useful number on your WhatsApp dashboard. Nine metrics that actually predict revenue and account health, and what each one should tell you.
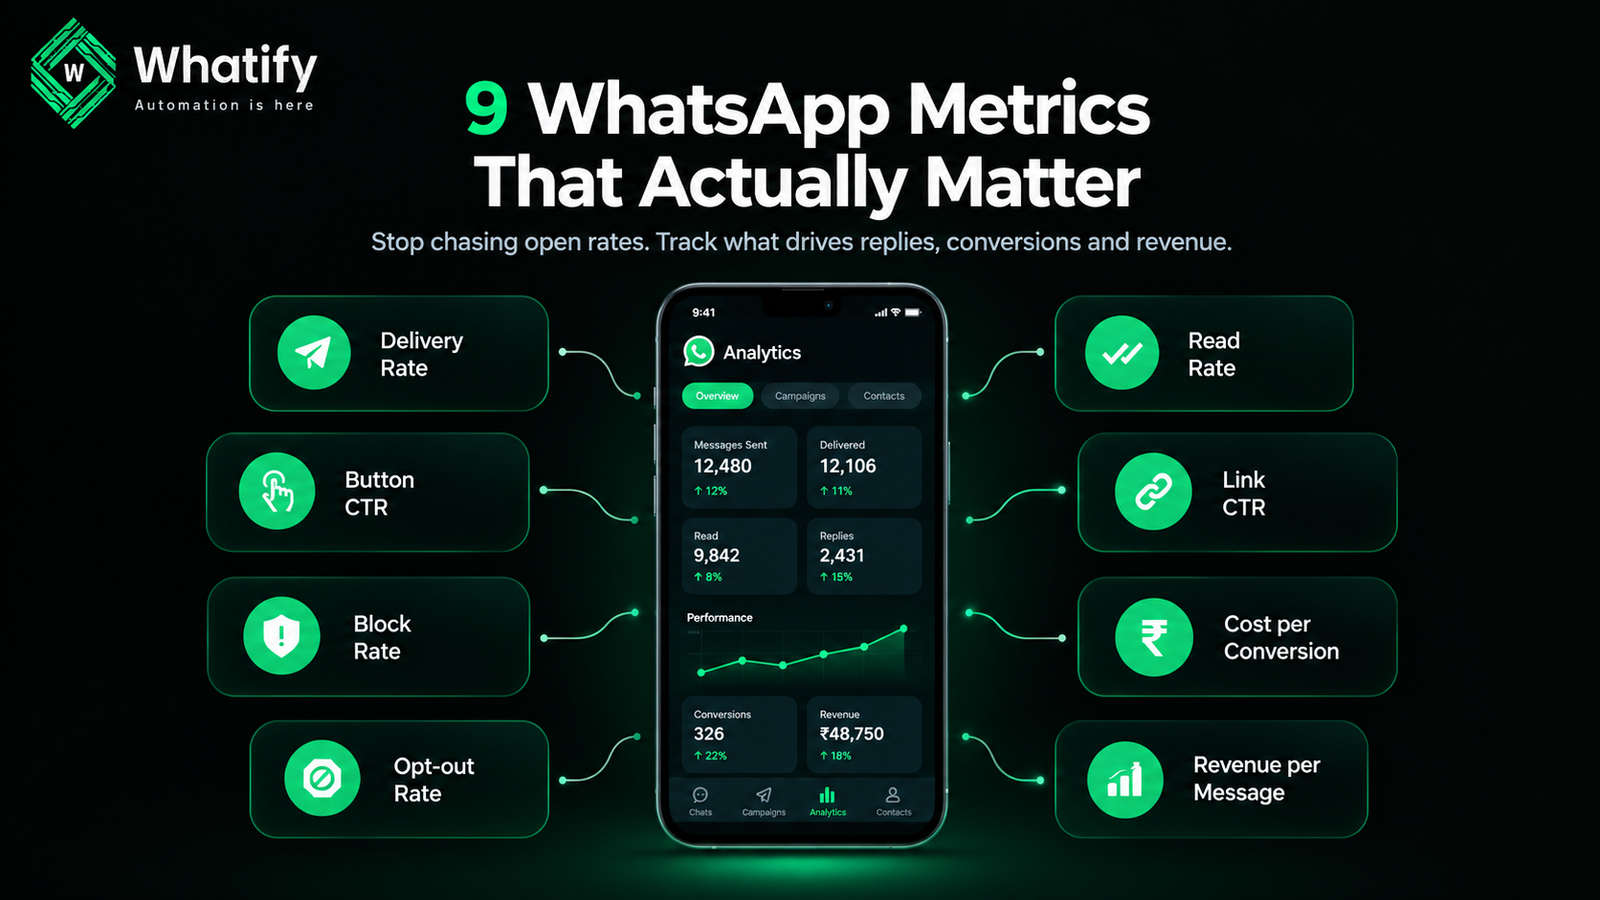
WhatsApp open rates look spectacular. Vendors quote figures north of 90%, and they are broadly accurate — people do open WhatsApp messages. Which is exactly why the number tells you almost nothing. If everyone's open rate is high, yours cannot distinguish a good campaign from a bad one.
These nine can.
Delivery and reach
1. Delivery rate
Delivered messages ÷ messages sent.
Meta bills on delivered messages, so this is a cost metric as much as a performance one. A drop usually means invalid numbers in your list, contacts who have blocked you, or an account-level problem. Below roughly 95% on a clean list, investigate before spending more.
2. Read rate
Read ÷ delivered.
Useful as a trend line rather than an absolute. Watch it fall across consecutive sends to the same segment — that is early evidence of fatigue, and it usually precedes a block-rate rise.
Engagement
3. Reply rate
Unique replies ÷ delivered.
The most honest engagement signal on WhatsApp. A reply is effort, and it also opens the 24-hour service window, which makes further conversation free. Design campaigns to earn replies rather than clicks where you can.
4. Button click-through rate
Button taps ÷ delivered.
Report per button, not per campaign. Two buttons on the same template routinely perform very differently, and the aggregate hides which message actually worked.
5. Link click-through rate
Clicks ÷ delivered, tracked with UTM parameters.
Tag every link. Without UTMs your WhatsApp traffic lands in analytics as direct or referral and disappears from attribution.
Account health
6. Block rate
Blocks ÷ delivered.
The metric most teams never look at and the one that determines whether the channel survives. Blocks feed directly into your quality rating, and a falling quality rating restricts sending. Review it after every marketing campaign, not monthly. Our quality rating recovery playbook covers what to do when it climbs.
7. Opt-out rate
Opt-outs ÷ delivered.
Counter-intuitively, you want opt-outs to be easy. A customer who taps Stop is far better for your account than one who blocks you, because an opt-out is invisible to Meta's quality signals and a block is not.
Track them together. If blocks exceed opt-outs, your unsubscribe path is too hard to find.
Money
8. Cost per conversion
Total campaign cost ÷ conversions.
Total cost means plan fee share plus per-message charges plus GST — not just the message rate. Our cost per message guide shows the full calculation.
This is the number to compare against your other channels. A campaign with a mediocre read rate and a strong cost per conversion is a good campaign.
9. Revenue per message sent
Attributed revenue ÷ messages sent.
Blunt but decisive. It answers the only question that matters at budget time and makes campaigns comparable across segment sizes.
Reading them together
Individual metrics mislead. Patterns do not.
|
Pattern |
Likely diagnosis |
|
High read, low reply, rising blocks |
Message is seen and unwanted — wrong offer or wrong audience |
|
Falling delivery over time |
List decay or accumulated blocks |
|
High clicks, low conversions |
Landing page or offer mismatch, not a messaging problem |
|
Good conversions, poor cost per conversion |
Segment too broad — you are paying to reach non-buyers |
|
Read rate falling across sends |
Frequency fatigue; reduce cadence |
A weekly review that takes ten minutes
Look at four numbers after every campaign: delivery rate, reply rate, block rate, cost per conversion. If all four are stable or improving, do nothing. If block rate rose while the others held, your targeting slipped. If cost per conversion rose while conversions held, your segment grew without getting better.
Change one variable per campaign. Testing a new offer, a new segment and a new send time simultaneously produces a result you cannot learn from.
Set a baseline before optimising
Run three campaigns to a stable segment and record all nine numbers. That is your baseline. Improvement is measured against your own history, not against benchmark figures published by vendors selling software — those are averaged across industries, geographies and list qualities that have nothing to do with yours.
Whatify reports delivery, read, reply and click data per campaign, and contact-level history sits in the CRM for attribution. See the analytics features or start a 14-day free trial.
EXTERNAL SOURCES
1. Meta — Analytics and insights, WhatsApp Business Platform documentation: available message status data and what delivery and read receipts represent. https://developers.facebook.com/docs/whatsapp/business-management-api/analytics
2. Meta — Pricing, WhatsApp Business Platform: confirmation that billing is based on delivered messages. https://developers.facebook.com/docs/whatsapp/pricing
Frequently Asked Questions
Open rates on WhatsApp are high across the board, which makes them poor at distinguishing good campaigns from bad ones. Track read rate as a trend line to detect audience fatigue, but judge campaigns on reply rate, block rate and cost per conversion instead.
Blocks feed directly into your quality rating, and a low quality rating restricts your ability to send. Poor performance on other metrics costs you a campaign, but a rising block rate can cost you the channel. Review it after every marketing send.
Add UTM parameters to every link in your templates. Without them, WhatsApp-driven traffic is recorded as direct or referral and cannot be attributed to a campaign. Use a consistent naming convention so campaigns remain comparable over time.
Opt-outs are healthier than blocks. A customer who taps Stop leaves cleanly with no effect on your quality rating, while a customer who blocks you damages it. If blocks outnumber opt-outs, your unsubscribe option is too hard to find — make it more prominent.
Divide total campaign cost by conversions, where total cost includes the per-message charge for the relevant category, a share of your plan fee, and GST. Using the message rate alone understates cost and makes WhatsApp look cheaper than it is against other channels.
Ready to automate your WhatsApp marketing?
Start your 14-day free trial today. No credit card required.
Start Free Trial